Possibilities of visualizing and using 3D mass data from surveys and modelling as well as official geodata in digital water engineering and digital municipal administration
In the context of ongoing digitalization of administrative and communication processes, high-performance database and software solutions are rapidly gaining in importance: The aim is to support and accelerate the decision-making processes of public authorities and administrations.
Further aspects play an important role regarding digital hydraulic engineering. In the framework of e.g. flood protection measures, data from surveying, planning, maintenance and modelling must often be combined and evaluated in context. The ongoing development of sensors for 3D water surveying and monitoring alone leads to highly detailed and complex mass data, the size of which can now amount to several terabytes. For example: The topo-bathymetric laser scan flight along the Elbe river of 600 km corresponds to approximately 5.5 terabytes of raw data!
Specifications and new technical possibilities make data bases more and more complex – this demands authorities, administrations and engineering offices alike.
Thus, the demands on hardware & software modules needed for storage, management and visualization of the data, increase already from the perspective of water surveying alone. In addition: The EU Water Framework Directive (EU, 2000) requires a regular resurvey of water bodies for monitoring purposes. This concerns both local authorities and administrations such as the Water Management Authorities in Bavaria as well as state institutions such as the Federal Waterways and Shipping Administration (WSV) in Germany.
Furthermore, beyond the field of hydraulic engineering, the requirements for municipal administrations and engineering offices for spatially related tasks are increasing: For example, in infrastructural planning such as road construction, the available 3D geodata on which planning is based are also complex. Different areal 3D geodata are available from the individual state surveying offices such as terrain, surface and building models (LoD1 & LoD2) or even the actual survey information of the laser point cloud of the respective state-wide survey flights.
1×1 km tiles vs. 3D data sets: Only comprehensive 3D data sets enable evaluations and the development of solutions.
At the surveying offices, these data are not available as uniform total data sets, but in 1×1 km tiles. In the case of large-scale planning projects, it is therefore required to combine many small-scale data sets at great expense in order to enable a comprehensive planning process. Interconnected 3D data sets are essential, e.g. to evaluate points of conflict with existing buildings or nature conservation areas in the case of different possible routes of a road or railroad line and to develop proposals for solutions (Fig. 1).
Here, too, the data volumes are considerable. But exactly this is the usual case when processing high-resolution laser point clouds. For example: AHM has combined the laser data from the Bavarian state flight into a total point cloud for the Bavarian State Office for Digitization, Broadband and Surveying (LDBV; Fig. 1). 510 billion points, data size of 10 Terabyte!
KomVISH and HydroVISH – For efficient handling of 3D geo-massdata.
Geoinformation systems (GIS) as locally installed desktop applications and online available Web Map Services (WMS) represent an established standard for spatial and integrative 2D geodata analysis, but are limited in the efficient handling of 3D geo-massdata and integrative 2D-3D analysis.
KomVISH and HydroVISH are compact software solutions for handling 3D survey data e.g. from topo-bathymetric laser scan flights or 3D geodata like digital terrain models.
– KomVISH is designed for the use in municipal administrations and allows the efficient linking of the 2D GIS world with the 3D world through appropriate GIS & WMS interfaces.
– HydroVISH offers larger authorities and administrations as well as engineering service providers the possibility to manage, visualize and link their data products as a whole.


HydroVISH for digital water engineering – Holistic consideration of spatial scales / temporal course.
Complex hydraulic engineering related data sets can be visualized and analyzed in HydroVISH in parallel. This includes underlying measurement data such as point clouds from topo-bathymetric surveys or echo soundings of river sections, hydraulic meshes from the inventory of an authority or newly created meshes (Fig. 2) as well as time-dependent hydraulic calculation results for e.g. a HQ100 (Figs. 2 & 3).
This also means that different data types are considered with respect to geometry: Points vs. lines like breaklines vs. surfaces like a hydraulic triangular mesh (Fig. 2). The advantage is the opportunity of a holistic view across spatial scales and the temporal course of a flood event.
This facilitates the impact assessment for individual buildings and parcels in the course of an event and the evaluation of individual protective measures (floodplains, embankments, retention basins, etc.) at the same time a flood event (Fig. 3).
Plausibility checks – for example the direct comparison of the actual measurement information from a point cloud with derived data such as a terrain model or hydraulic calculation network – ensure data quality (Fig. 2).
KomVISH for digital municipal administrations – Enables real-time visualization of 3D-geo-massdata.
Official Geodata are partly freely available to municipalities and authorities via the respective state surveying offices, as in Thuringia and North Rhine-Westphalia, or can usually be used in the course of a framework agreement, as in Bavaria. Geodata are also increasingly oriented towards the third dimension. In Bavaria, for example, the LDBV provides access to the state-wide 3D data sets of the LoD2, DTM, DSM or the laser point cloud (Fig. 1). Without the appropriate software tools, however, access to these mass data remains difficult – especially their real-time visualization.
– KomVISH, as a simplified version of HydroVISH, is the first software solution for the use of these 3D geodata in the municipal environment with simultaneous coupling to different GIS platforms via appropriate interfaces (ESRI ArcGIS Pro & ArcMap as well as Kominfo, Fig. 4).
The 3D geodata are displayed in real-time parallel to the projects available in the 2D GIS (e.g. cadastral map, ortho images, technical data) and spatial references can be easily established: Distances between buildings, dimensions of tree tops or buildings, the distance to overhead power lines, height differences between roofs, clearance profiles of roads or bridges as well as simple interactive geometric cross-sectional views.
▪ Individual 3D datasets can be visualized and analyzed separately or in combination (Fig. 4 right).
▪ 3D-profile lines or height measurements can be transferred from KomVISH to the GIS application (Fig. 4).
▪ KomVISH includes an additional direct linkage to WMS for an improved orientation (BayernAtlas 2D & 3D, OpenStreetMap), which is further supplemented by the integration of the HERE map service for a specific address search possibility.
▪ An integrated commentary function can support the information exchange both between individual data users and processors in the municipalities and authorities and between the 3D and 2D software applications.


KomVISH and HydroVISH on the Web – Processing and interactive data handling in home office and field service without limitations.
As pure desktop applications, HydroVISH and KomVISH allow to access and analyze datasets stored locally or on a server in an internal network. Thus, to ensure effective use of the data at the workplace, there are corresponding technical requirements for memory, RAM or graphics card, as with other desktop applications as well. In the pandemic year 2020, the trend in public authorities and administrations, but also in companies, towards more home offices with networked end devices and digital workflows is now intensifying from a health and economic point of view. The trend toward web applications instead of desktop applications, which was already on the rise before, facilitates or accelerates the transition from office work to the home office, but is dependent on the availability of appropriate web technologies. The latter must be based on the lowest common denominator of the capabilities of the web browsers, i.e. they inevitably lag behind on what is technologically possible and the actual performance of the utilized hardware.
Although there are numerous web solutions, especially in the field of GIS, these are partly limited to two-dimensional map displays, as with WMS services. Or they are subject to massive data reductions in the visualization of 3D data. With processing and interactive data handling in the home office, such limitations are quickly reached. Especially when working under the premise of the highest possible accuracy for best possible results. But this is exactly the normal case when processing laser point clouds – such as the aforementioned laser data of the whole of Bavaria with 10 terabytes. Downloading such a large data set, no matter how good the data connection is, is not practical.
In the technological information box, we therefore present two possibilities for remote access via web browser to the two desktop applications KomVISH (Fig. 5) and HydroVISH and compare them with the actual desktop and a WebGL application. In this way, we support both efficient work in the home office and the necessary networking of end devices, which is important in field service, for example (Fig. 6).


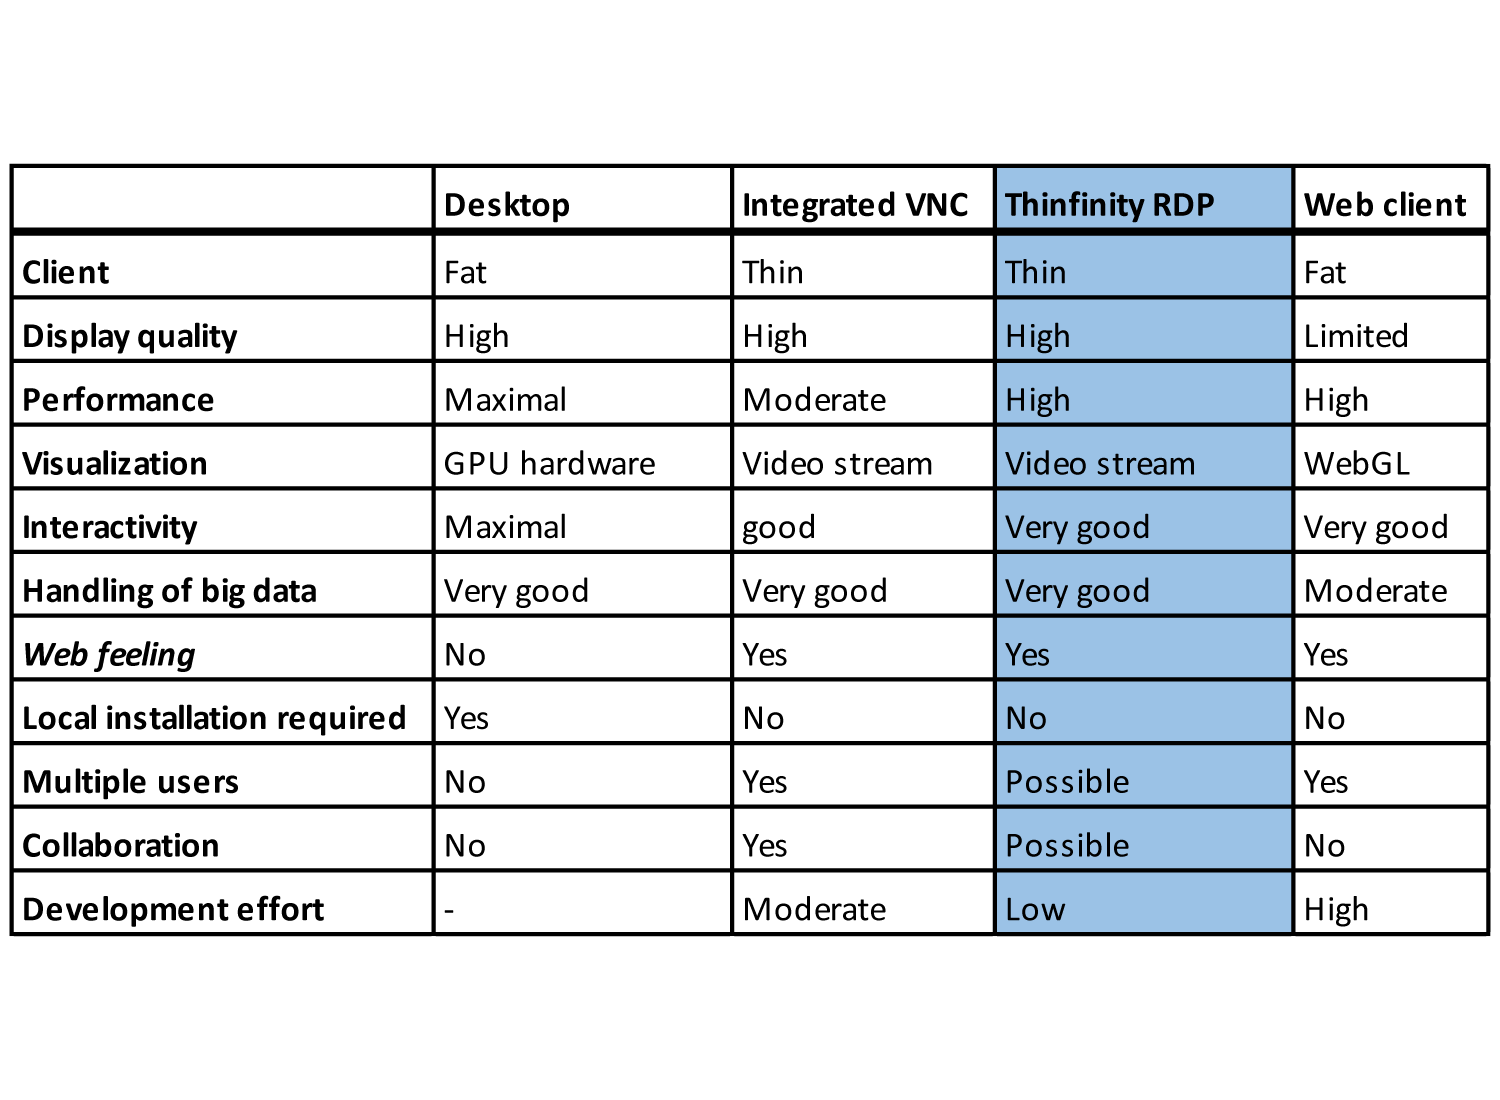
Technology comparison: Desktop- vs. web-application and hybrid solution
The requirements for the direct visualization of high-resolution point clouds are much higher than for the area-based representation of geometries or the 2D representation of maps. Table 1 shows the comparison of possible technologies in relation to the maximum version on a desktop computer. VNC (Virtual Network Computing) is a solution that can be integrated directly into the desktop software and thus allows remote access to an already running application. In most cases, VNC is then used as a ready-made application for remote access to the entire desktop, which is not necessarily desirable. The web user expects that everything is done when opening a web page (web feeling in table 1). An alternative to VNC is RDP (Remote Desktop Protocol), which is already an integrated part of the Windows operating system. In this basic configuration, RDP also only provides full desktop access. With the Thinfinity Remote Desktop Server from Cybele Software (https://www.cybelesoft.com/thinfinity/remote-desktop/server/) it is possible to limit remote access to only certain applications. No program installation is required on the end device, the client runs exclusively in a web browser based on HTML5 technology. In addition, Thinfinity RDP offers the possibility that several users can view the same displays together (collaboration), which is not possible with RDP in its basic version. VNC also offers this possibility, but does not come close to the performance of RDP optimized for Windows. In contrast, the variant of a specifically developed web client, which, like the desktop application, requires a powerful computer (fat client vs. thin client), but is technologically not very interesting for our application scenarios due to WebGL limitations (e.g.