HydroVISH
Your step into handling mass geodata on your own
HydroVISH is far more than “just an app” – it is an entire framework that enables you to perform all the steps in your geodata project. It is a fast, powerful, and highly flexible software with a solid C++ core for advanced data visualization and processing. Four building blocks allow the efficient processing, rendering and analysis of mass data.
MODULARITY
HydroVISH is designed in a flexible, extendable way that allows for new modules to be easily created and modified.
INTEGRATION
POWER
SPEED
HydroVISH Functions Overview
It’s more than just point cloud viewing – it’s about real data interaction
Data preparation just for visualization purposes is considered impractical in our vision. The HydroVISH/KomVISH system allows you to look at massive raw data, then analyse and perform any further processing steps

PROCESS
Use integrated tools for mass data processing
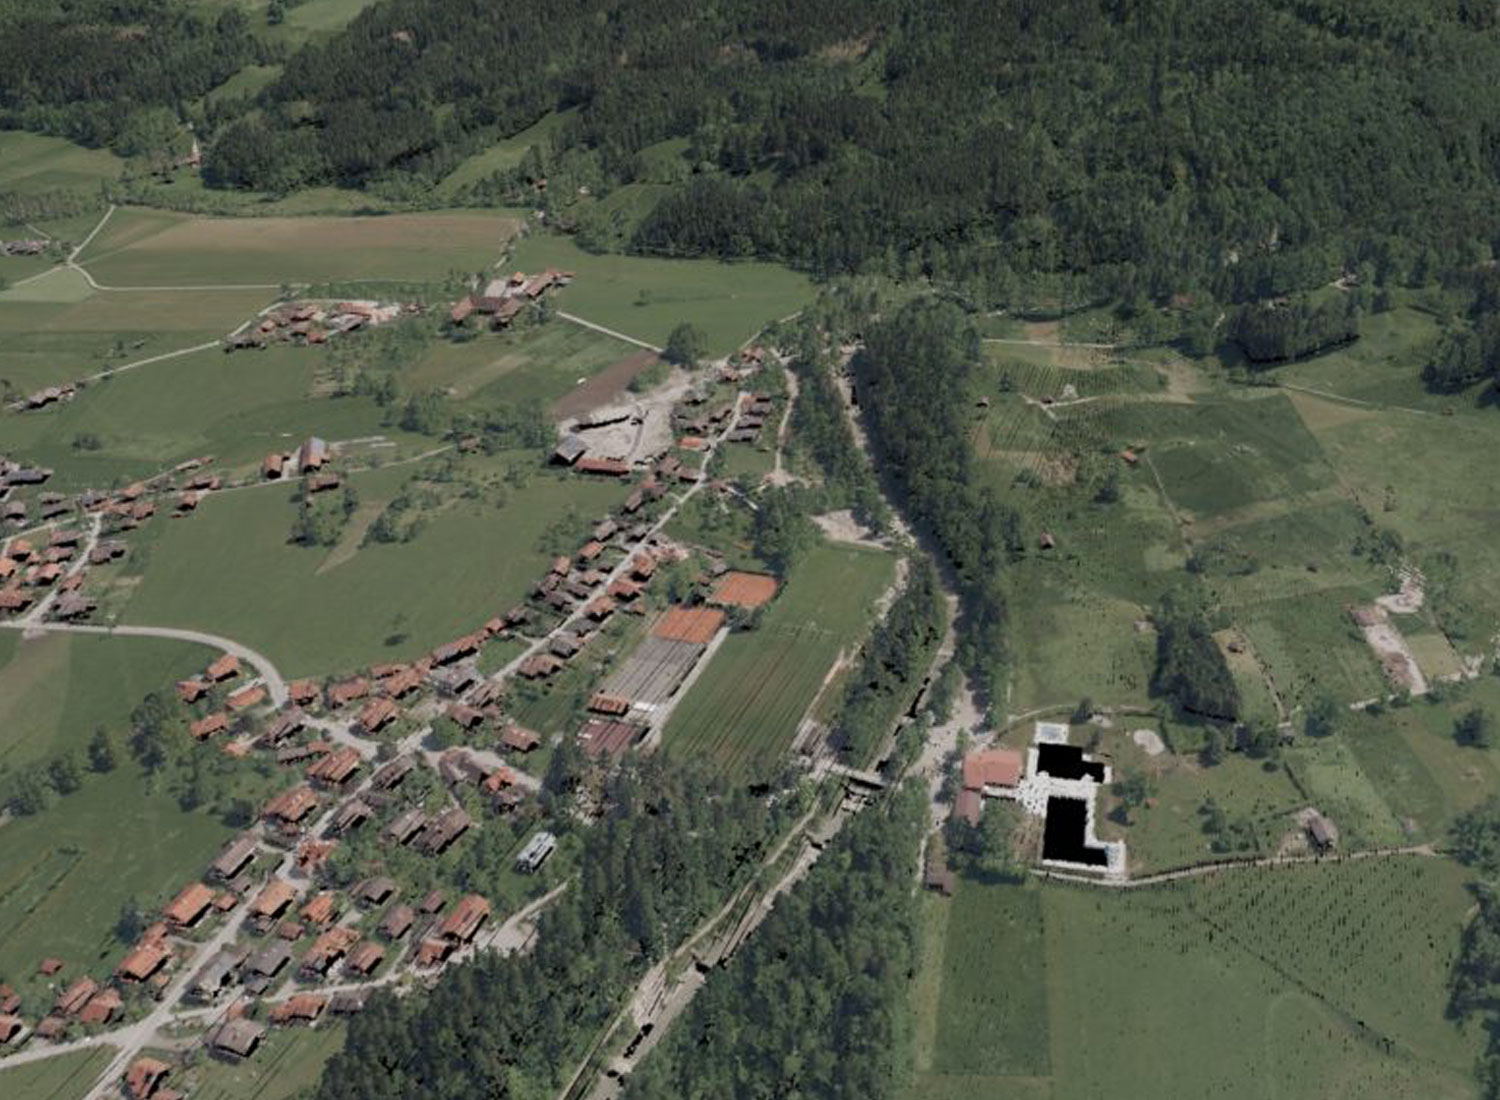
- Efficiently extract sub-datasets such as community outlines from terabyte sized data set to use in other applications (see Bavaria Project)
- No streaming server required: direct reading of data from locally stored files with zero overhead and faster-than-disk I/O compression algorithms (HDF5 S3 or other I/O layers)

VISUALIZE
Enjoy a fast and powerful visualization of massive point clouds
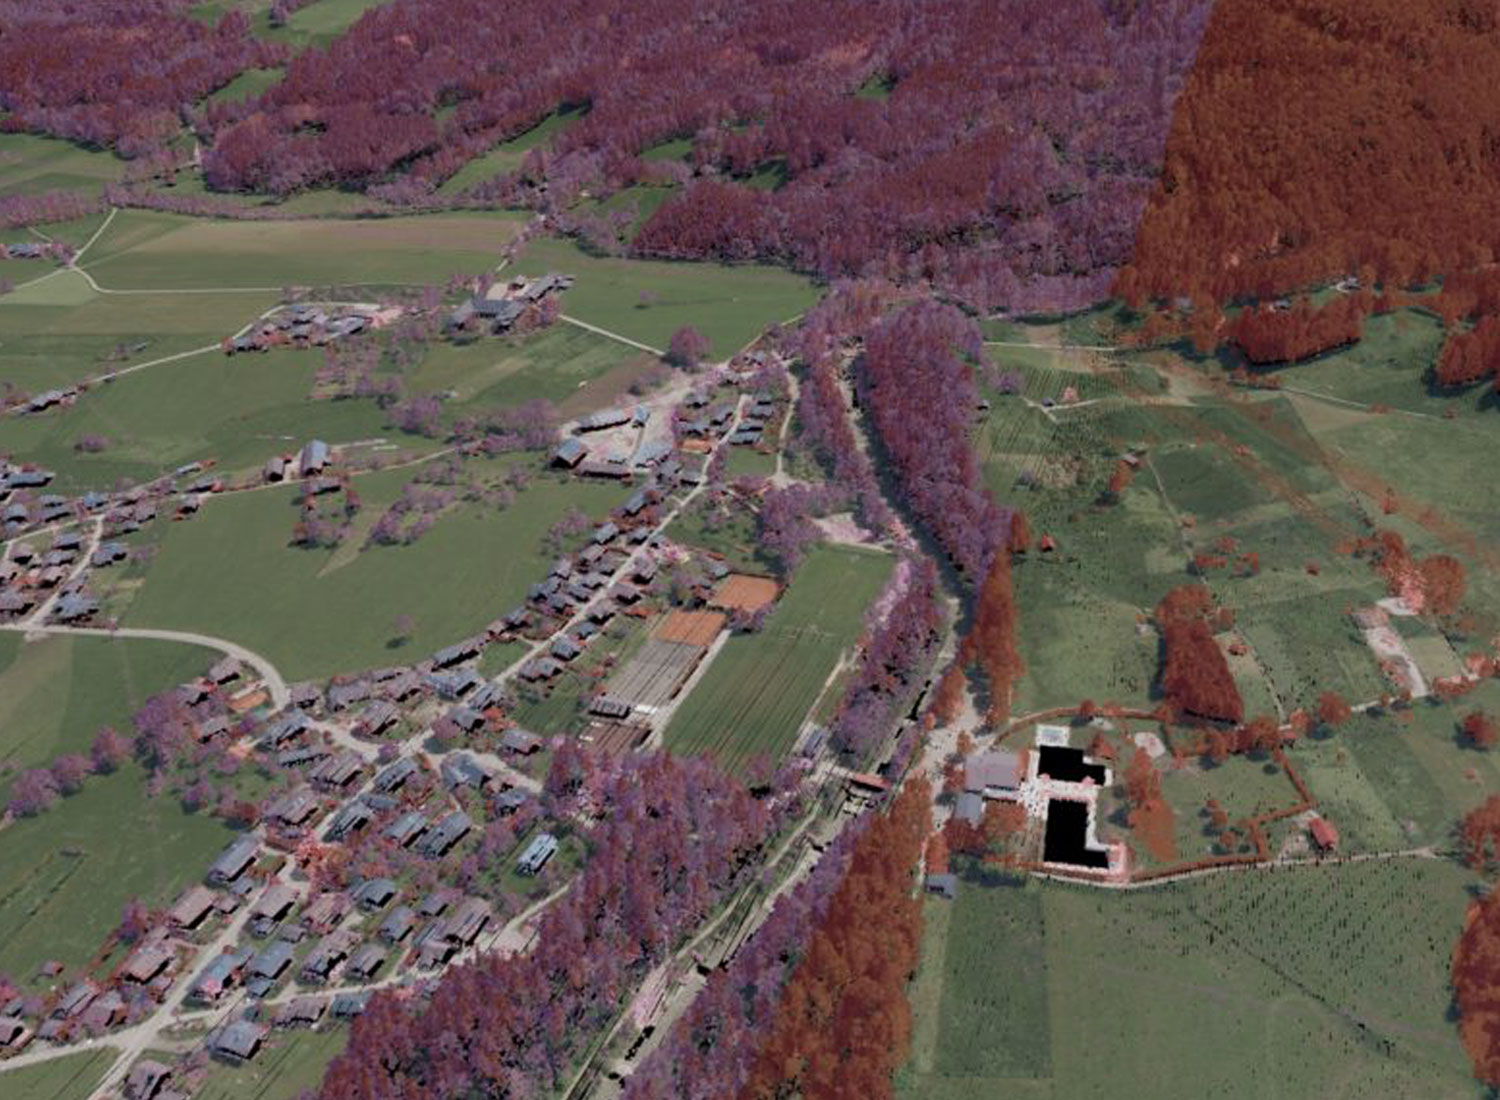
- Unbound visualization of point clouds and geometries: lines, planes, volumes, and combinations
- Visualization of full LIDAR waveforms for massive data representation on point clouds – 100x more data than points only

INTERACT
Tune the parameters you are interested in
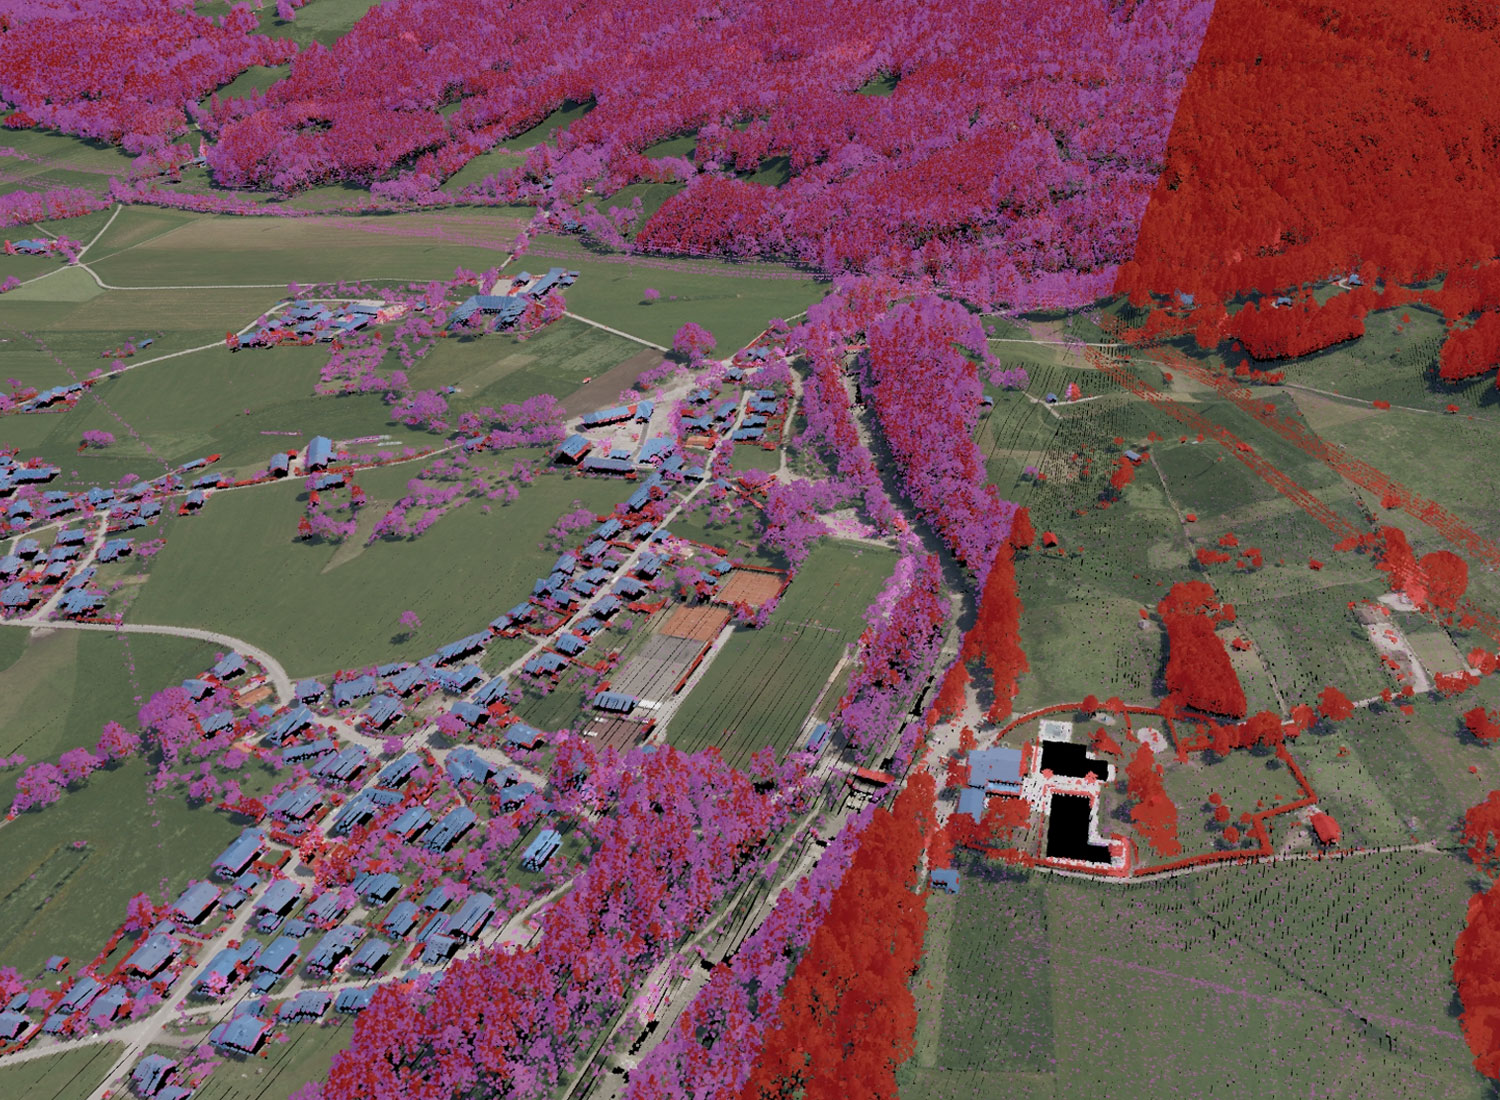
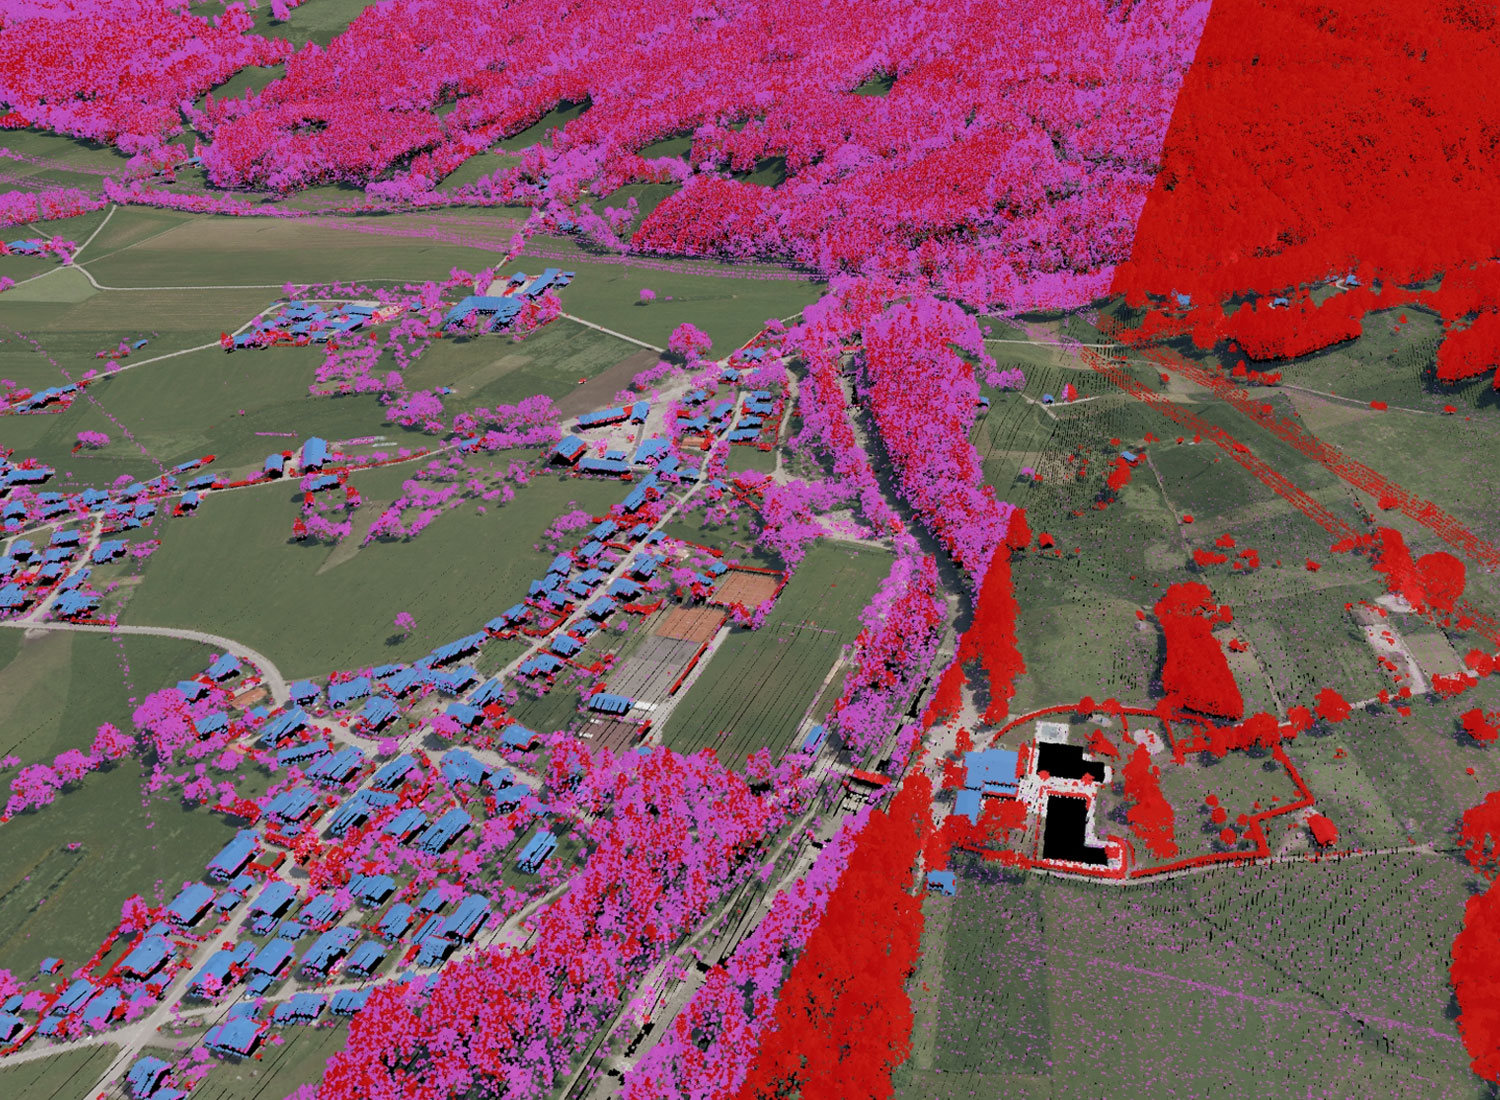
- Directly operate and modify data (e.g in terms of classification). Any data field – scalars, vectors, tensors – can be colored and combined
- This means you can:
- Evaluate point cloud characteristics
- Compare different point clouds from different acquisition techniques or dates
- Draw directly on the point cloud with polygon export (extendable to meshes)
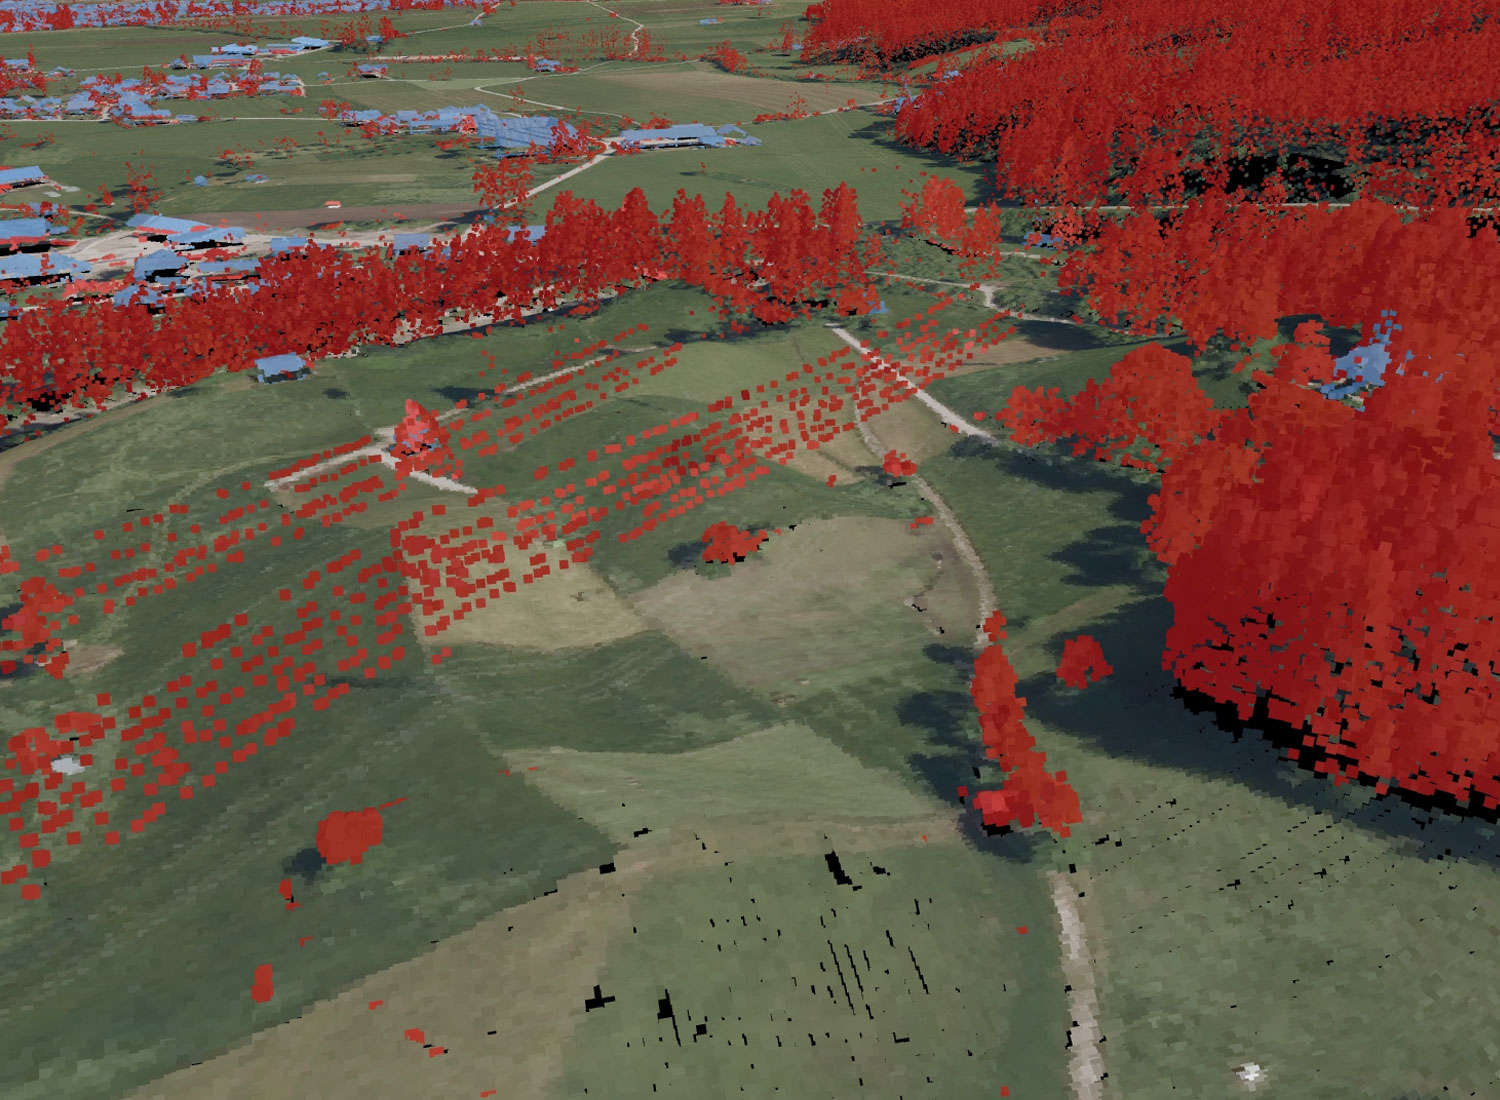
LIDAR Full Waveform Analysis
LIDAR Full Waveform Analysis

Dots, not Points
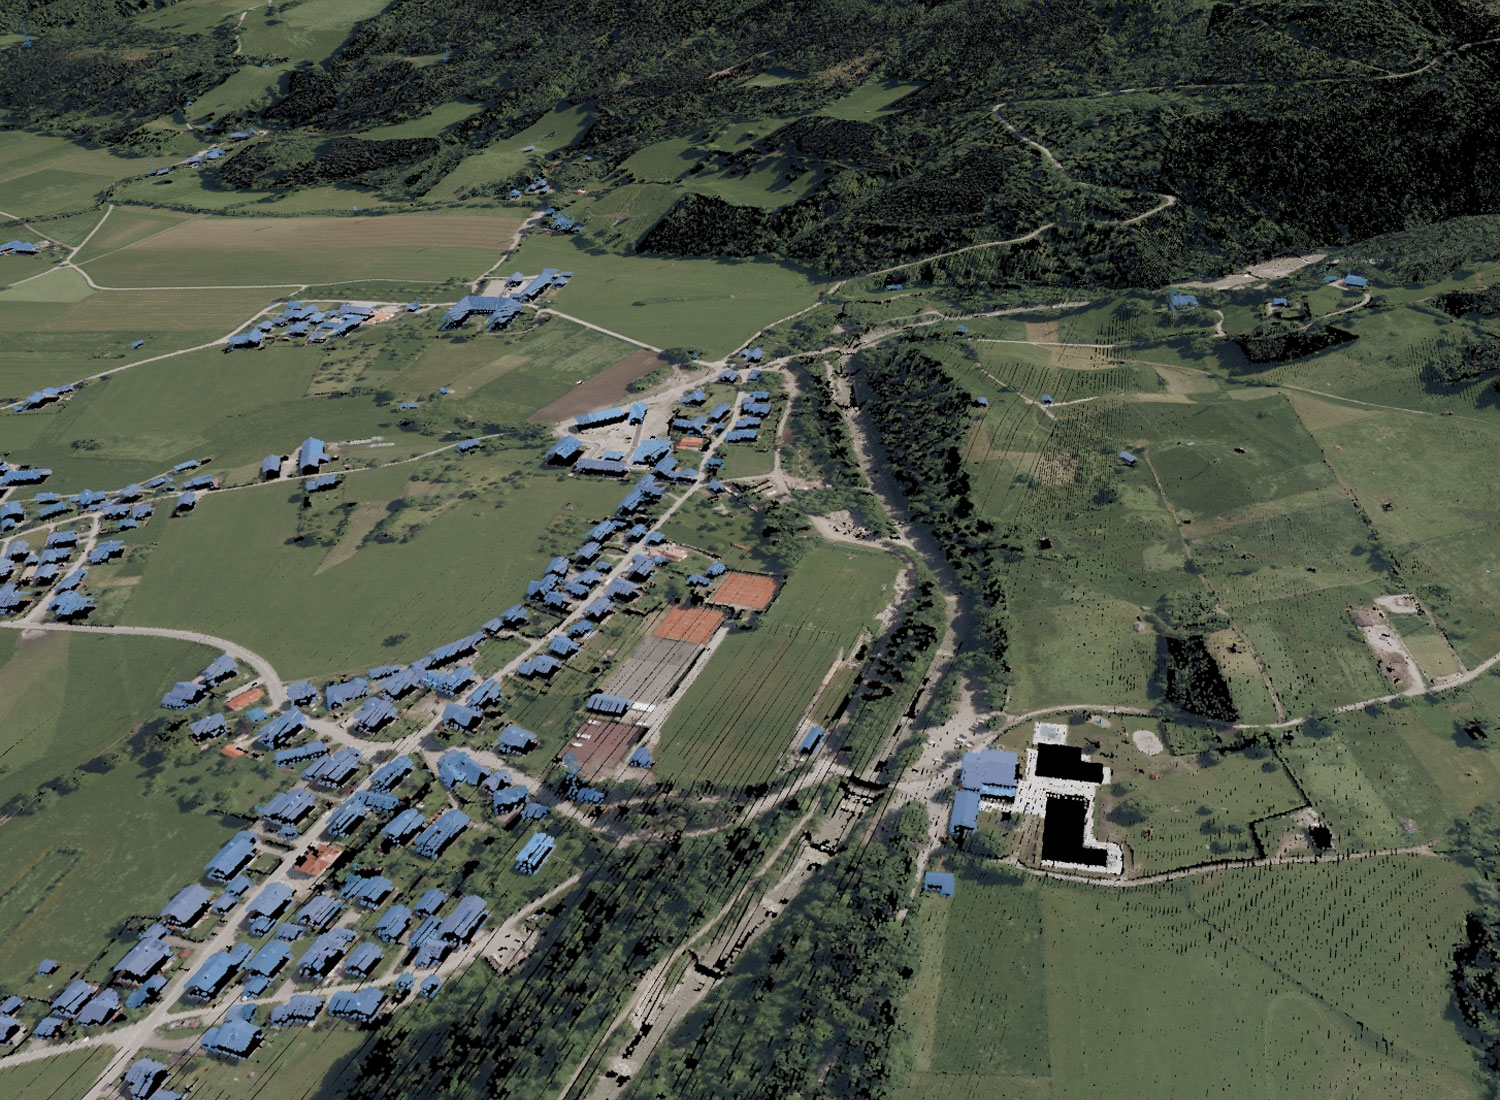
While many applications display point clouds as points that are of the size of singular pixels, we have visualization methods that use dots of extended geometry to represent points. This approach allows for dense and perspectively correct coverage of the screen area with less actual data points but sub-point-sized pixel precision.
On our extended-geometry dots we can display additional quantities such as contour lines indicating height or a coordinate grid. Furthermore these dots can be aligned in 3D according to a given normal vector field, for instance derived from a height field, triangular mesh, or point cloud neighborhood analysis. Thereby the dot display becomes increasingly realistic and can additionally be used to study a normal vector field for quality assessment.
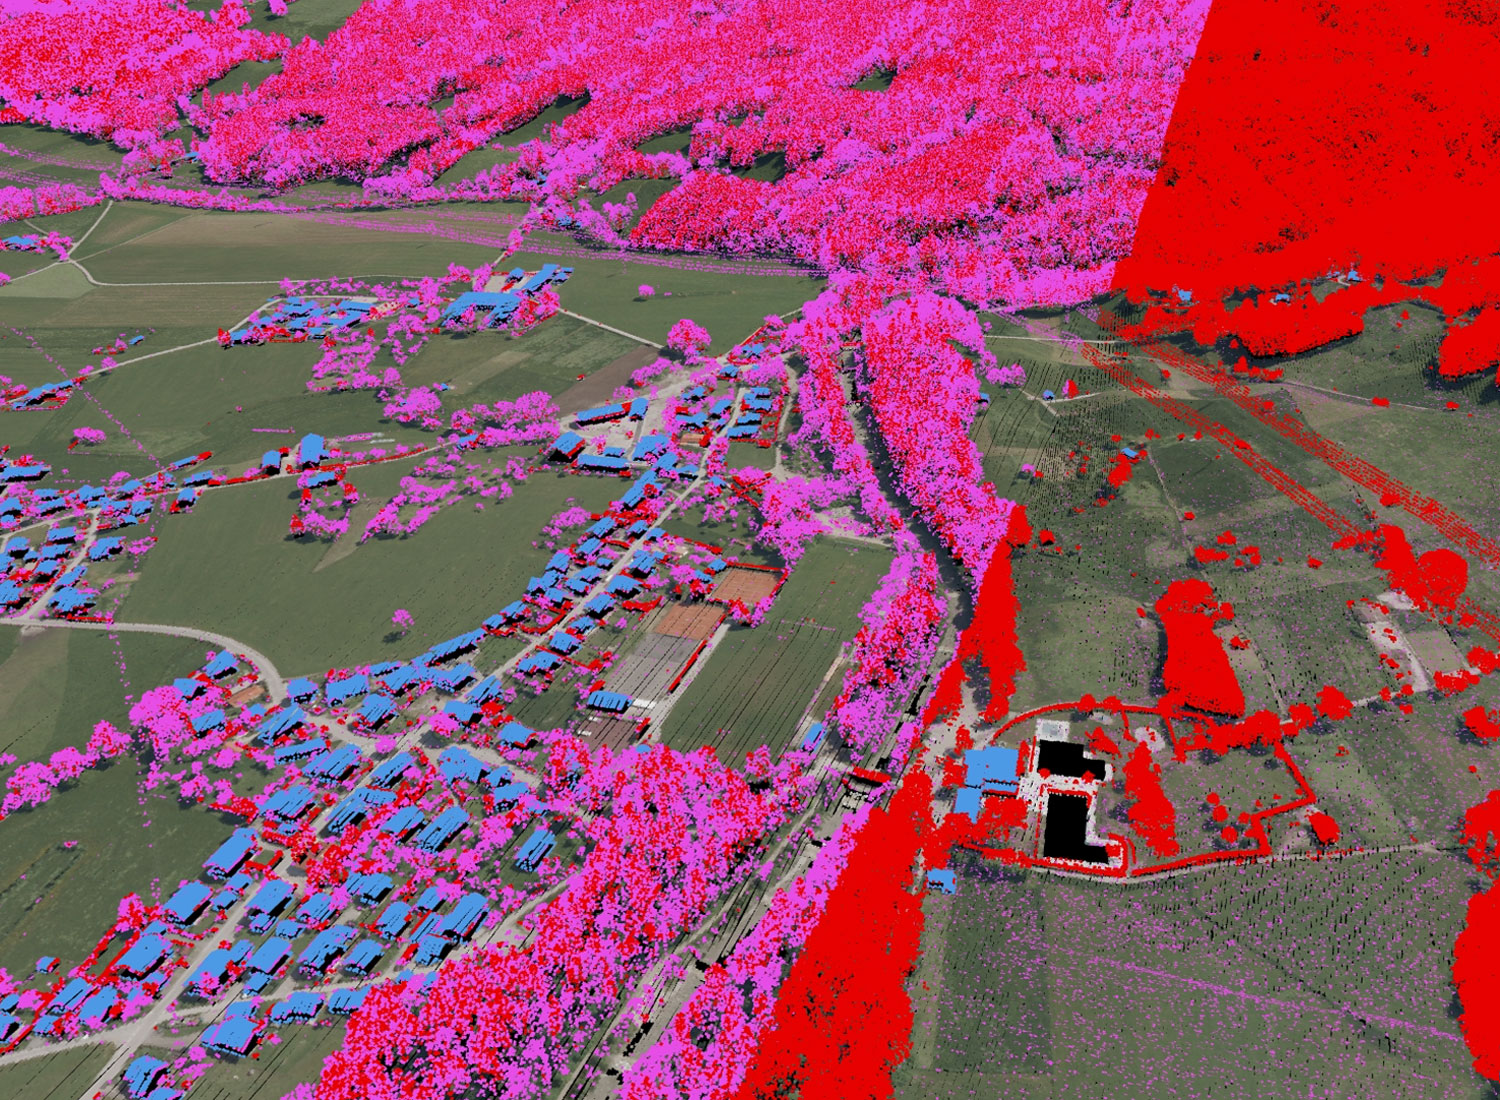
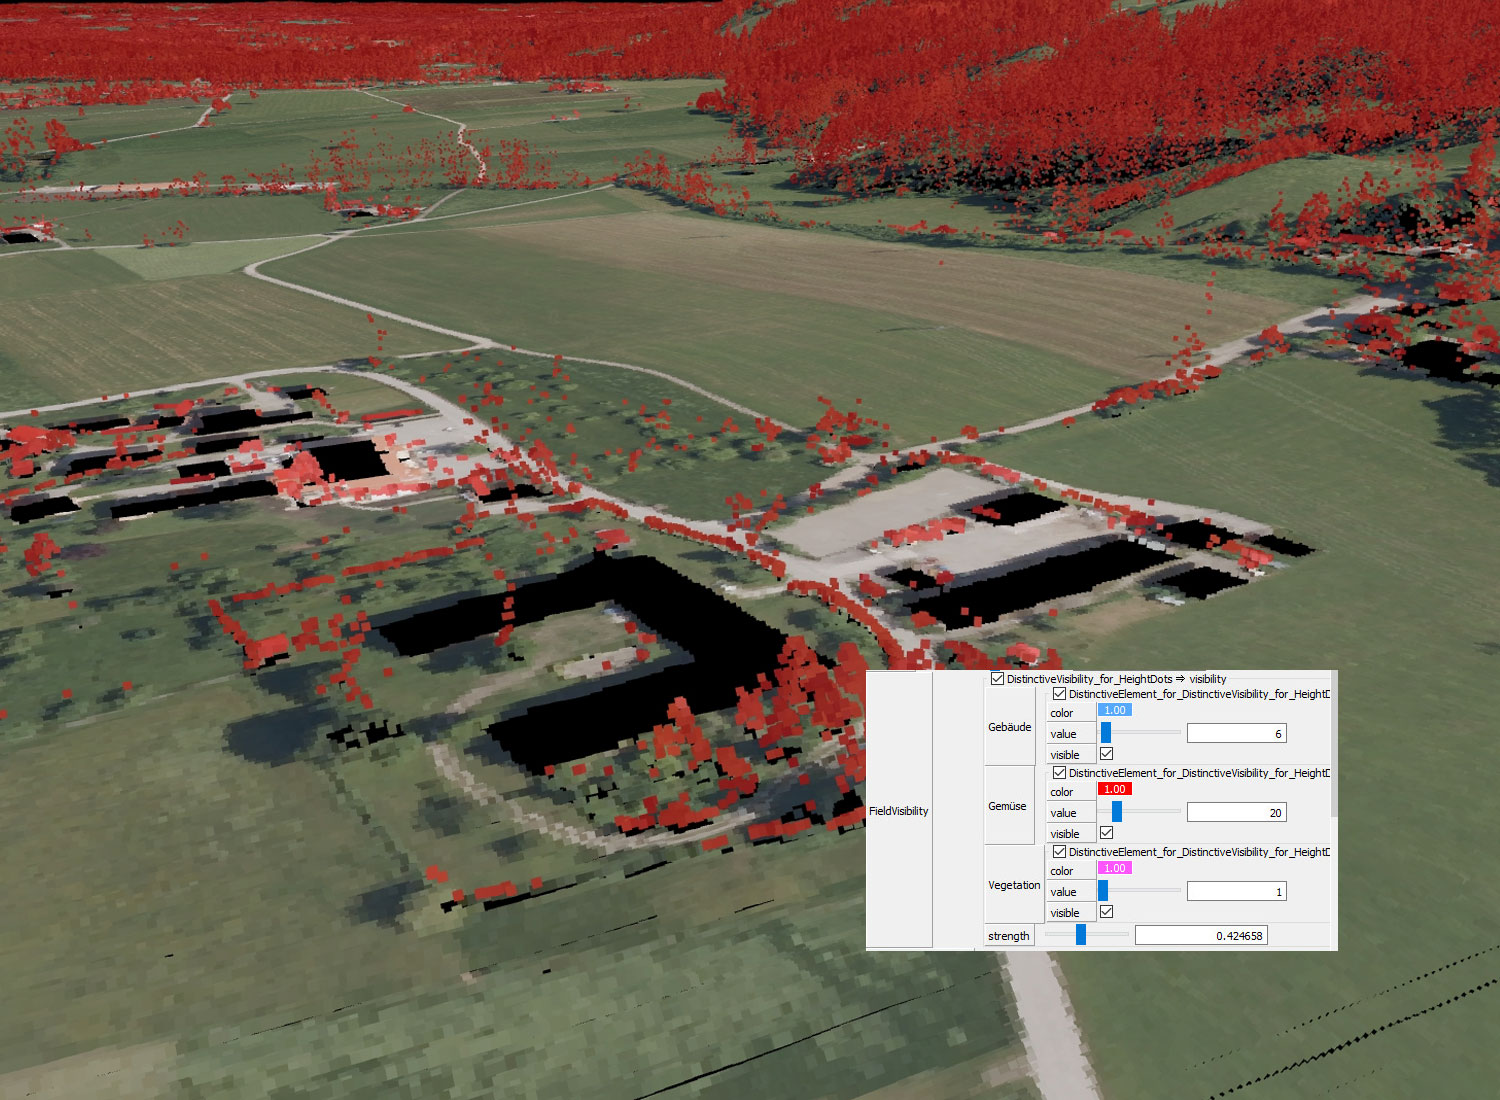
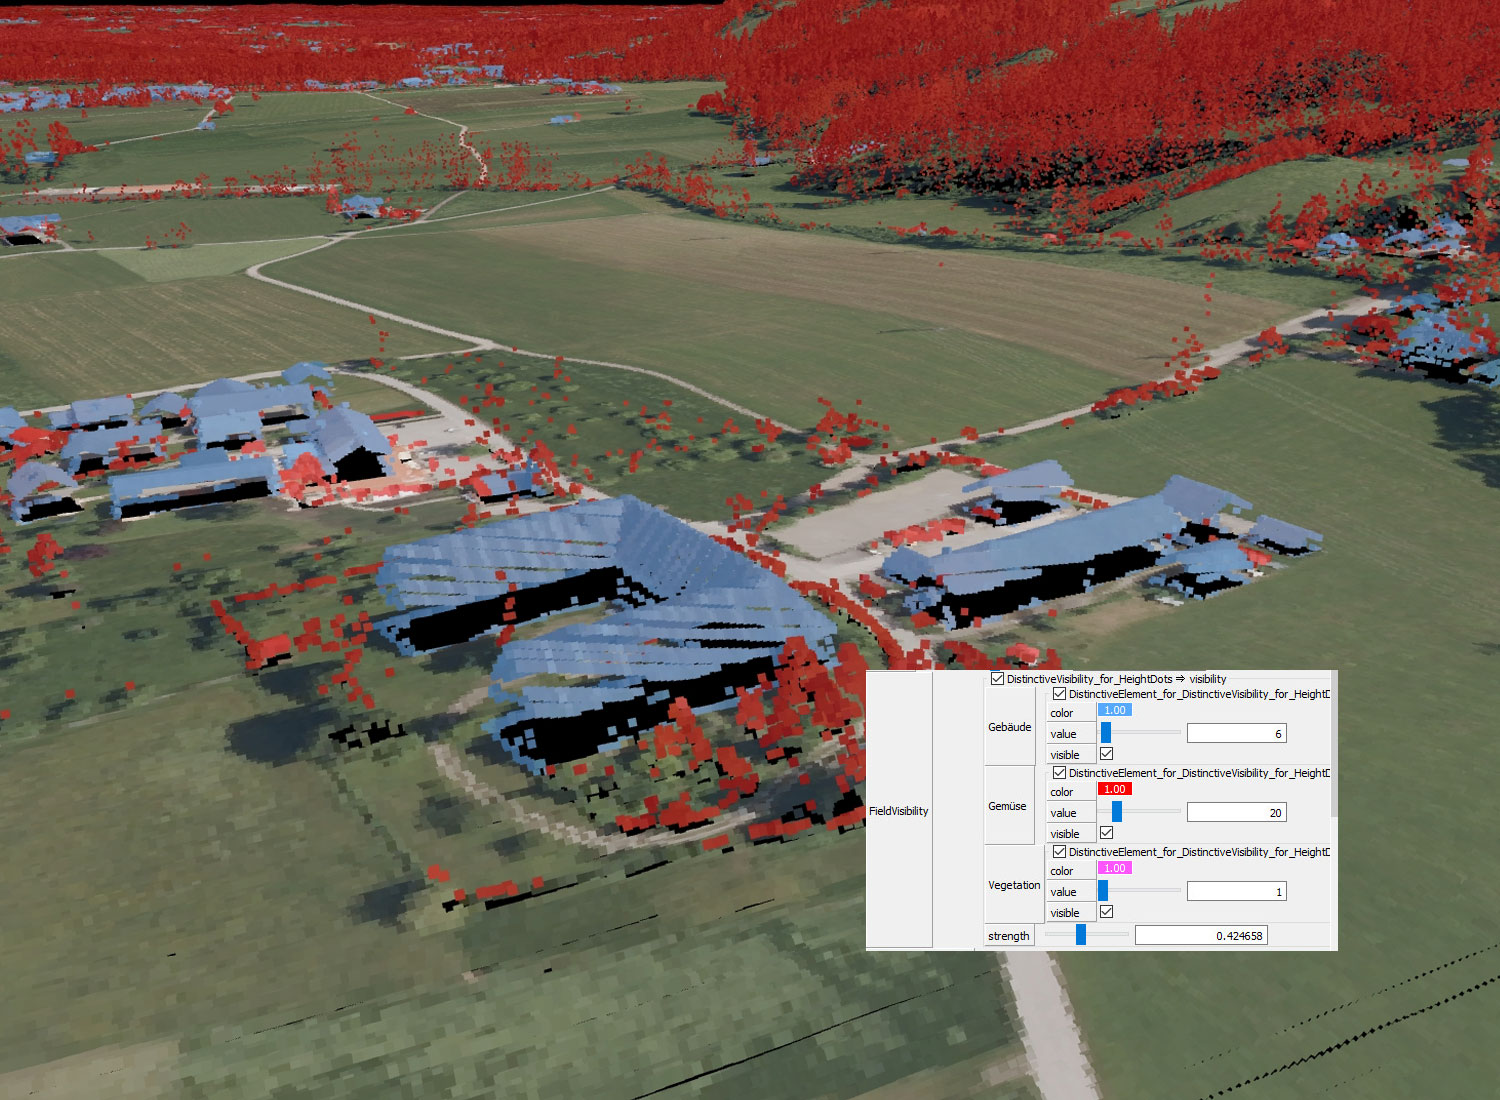
Selective Display Field Visibility
Field Visibility is an optional feature of HydroVish’s point rendering module to adjust a point’s colorization in dependence of other data given per point such as an integer value labelling a certain property. For integer labels (such as the result of a classification process) an overlay color can be assigned that may be smoothly blended with the existing RGB values. All points with a specific integer value can also be hidden. All these operations are shown in real-time immediately as part of the interactive rendering.
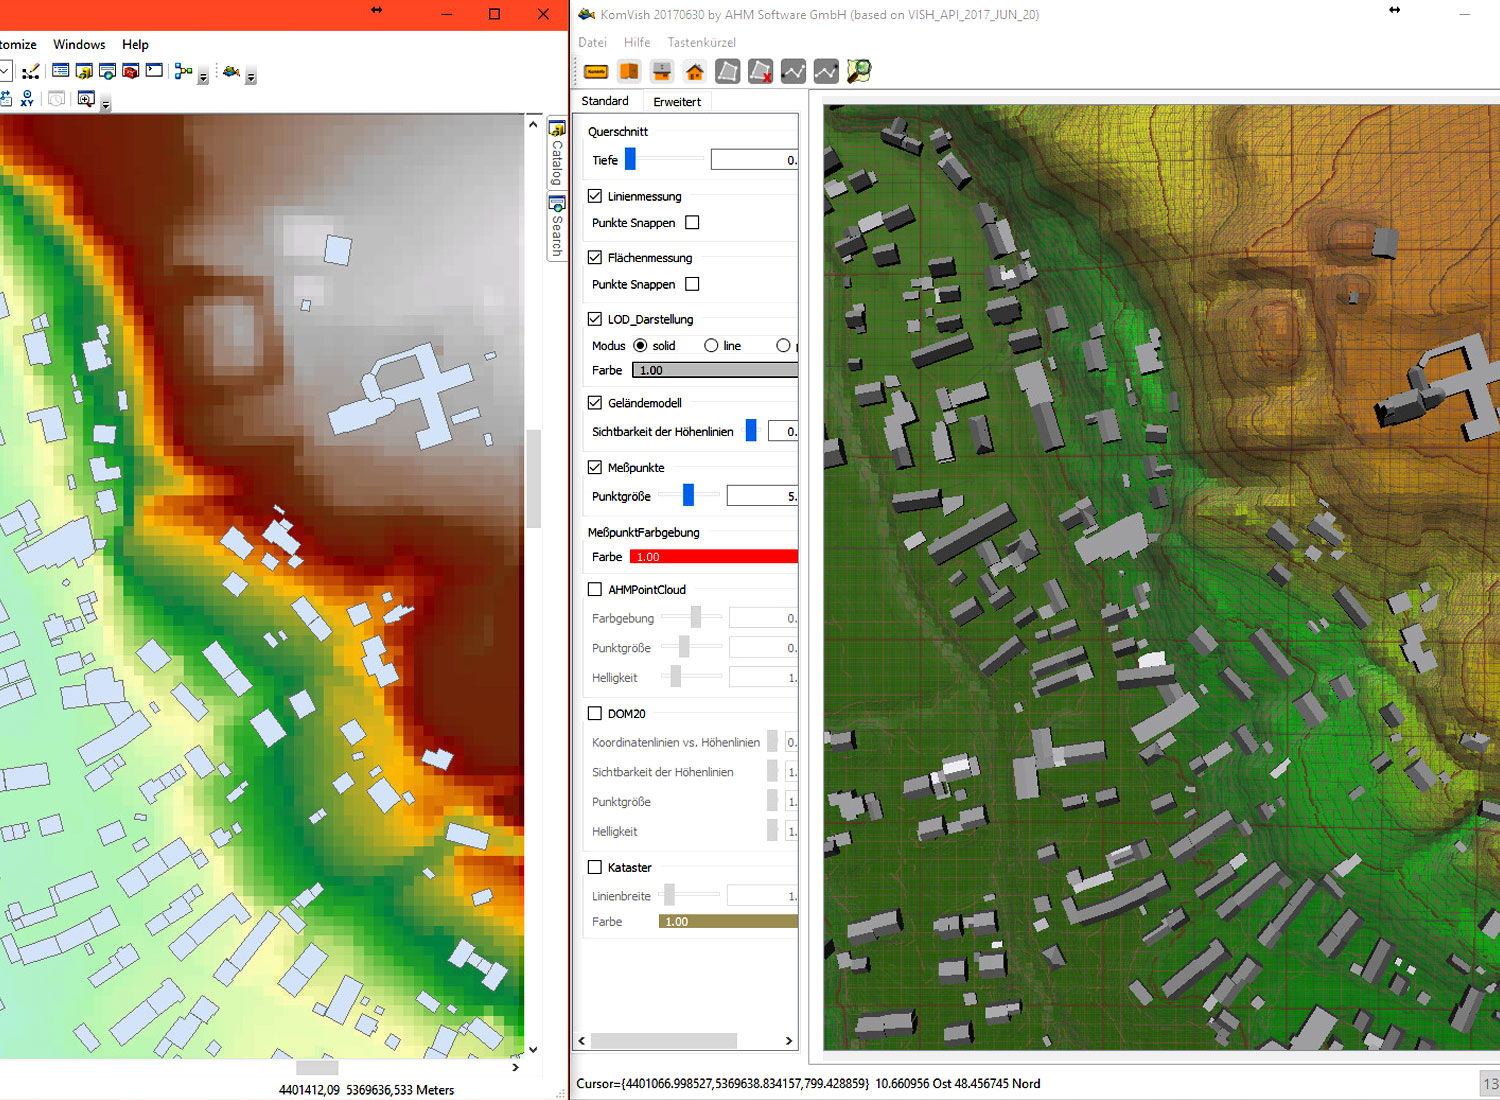
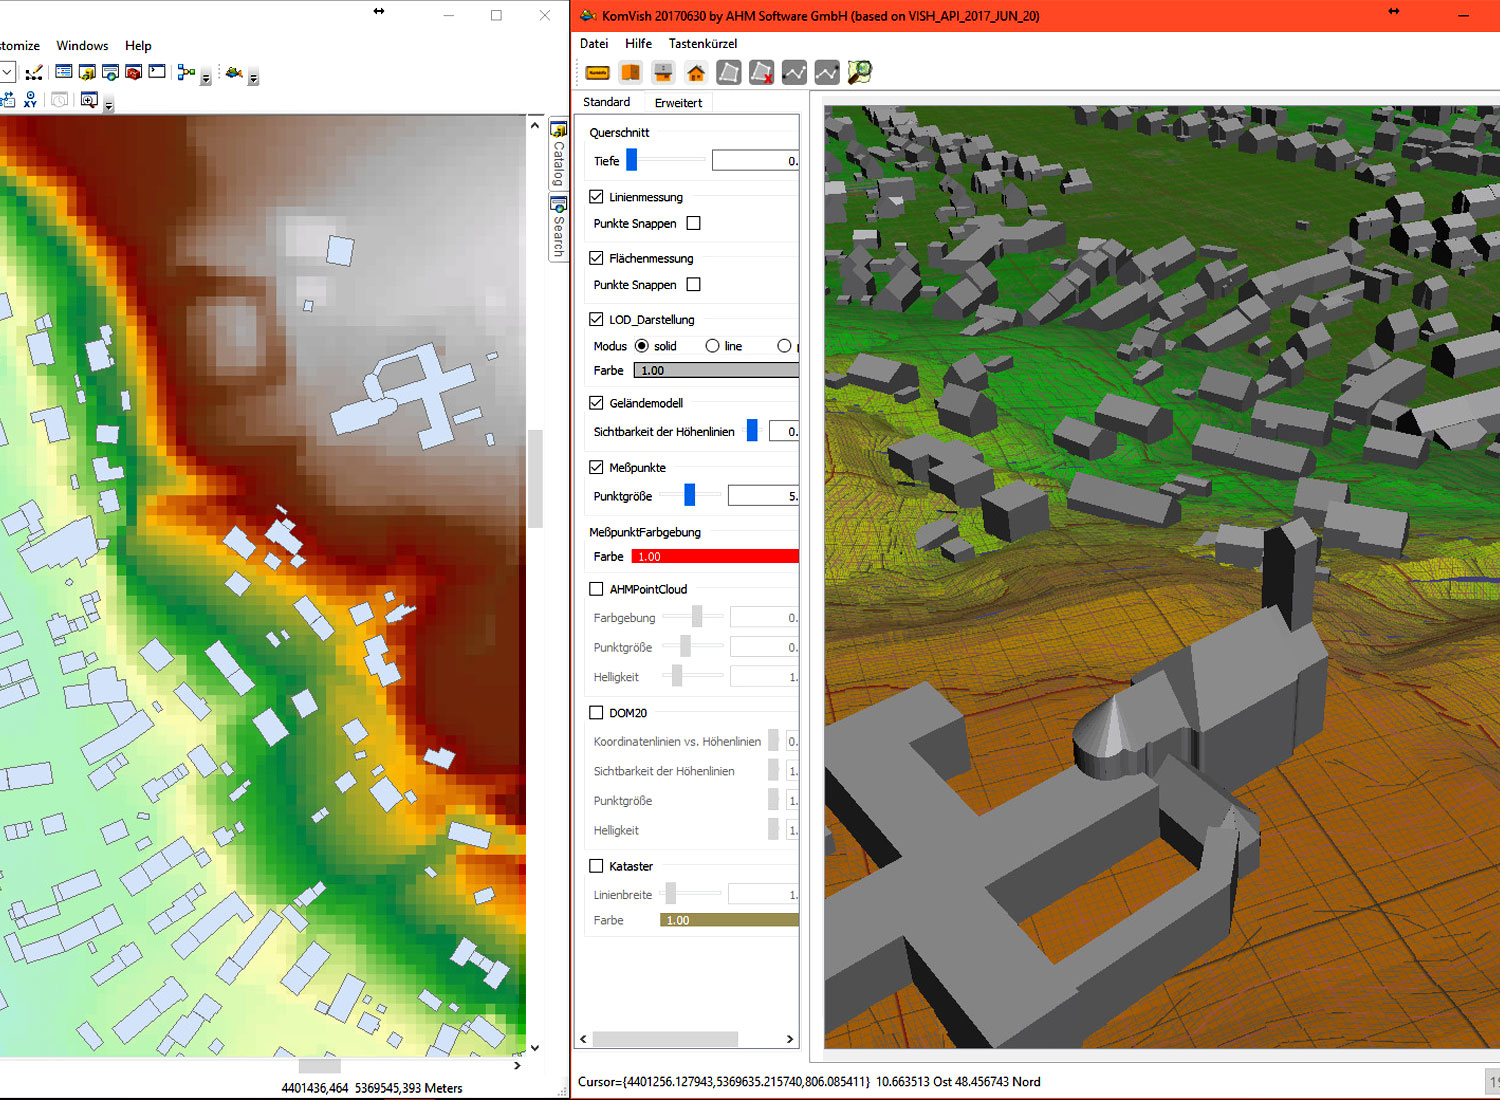
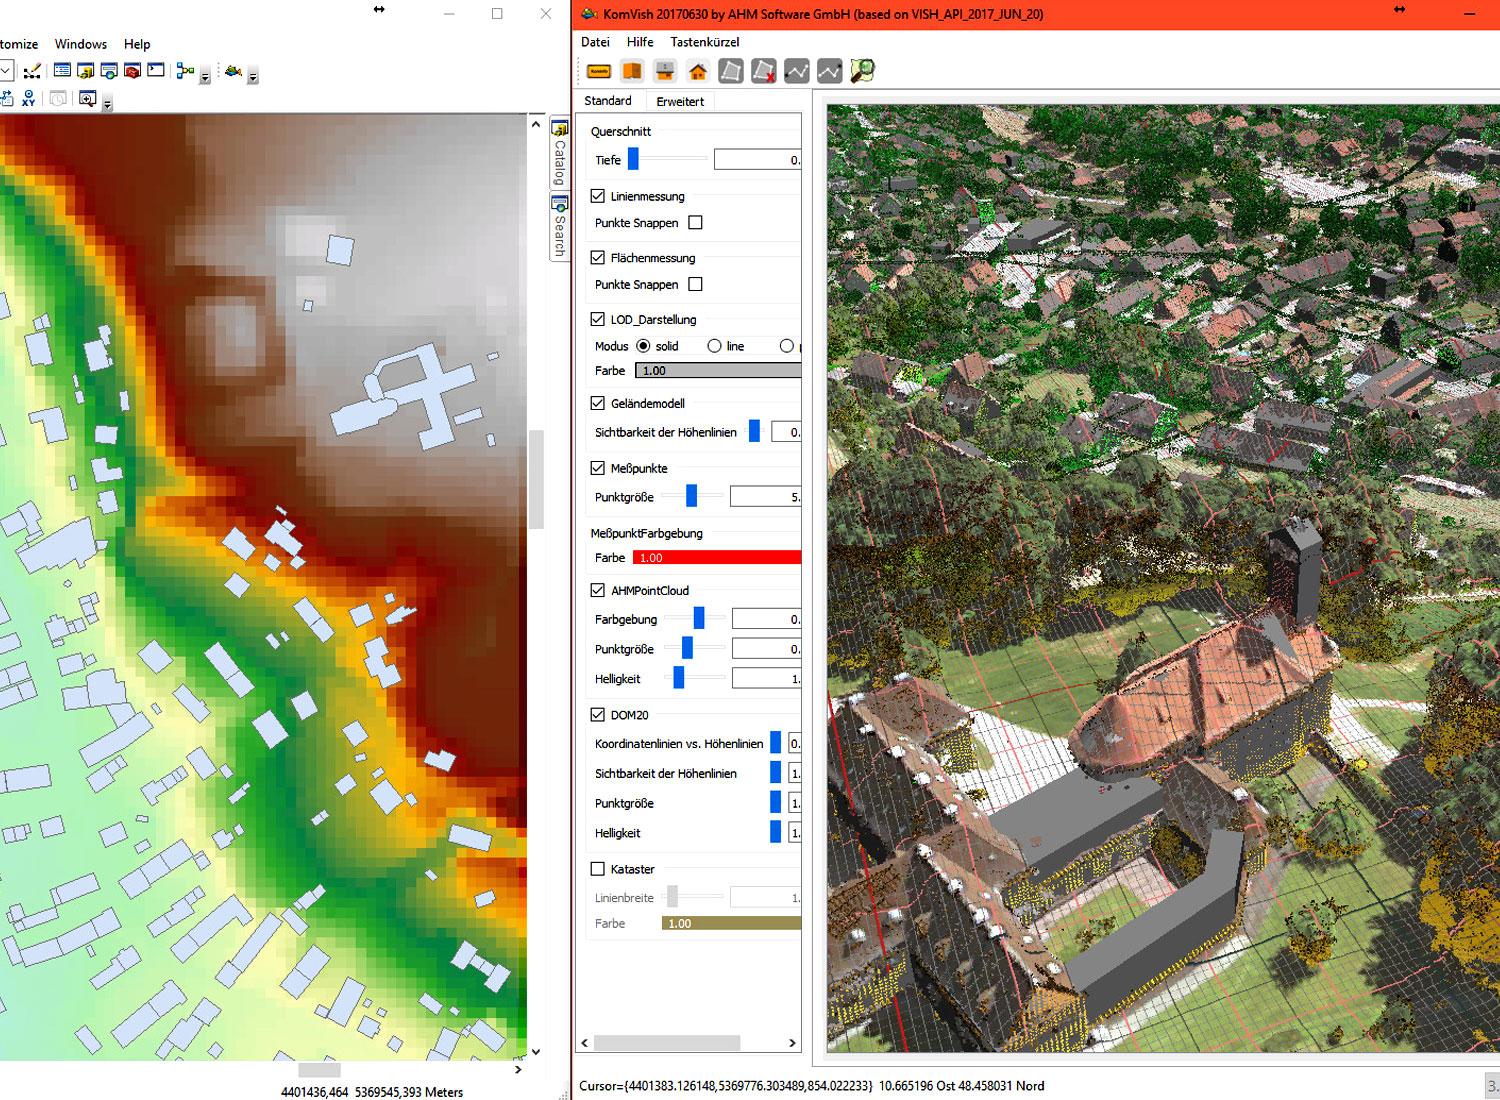
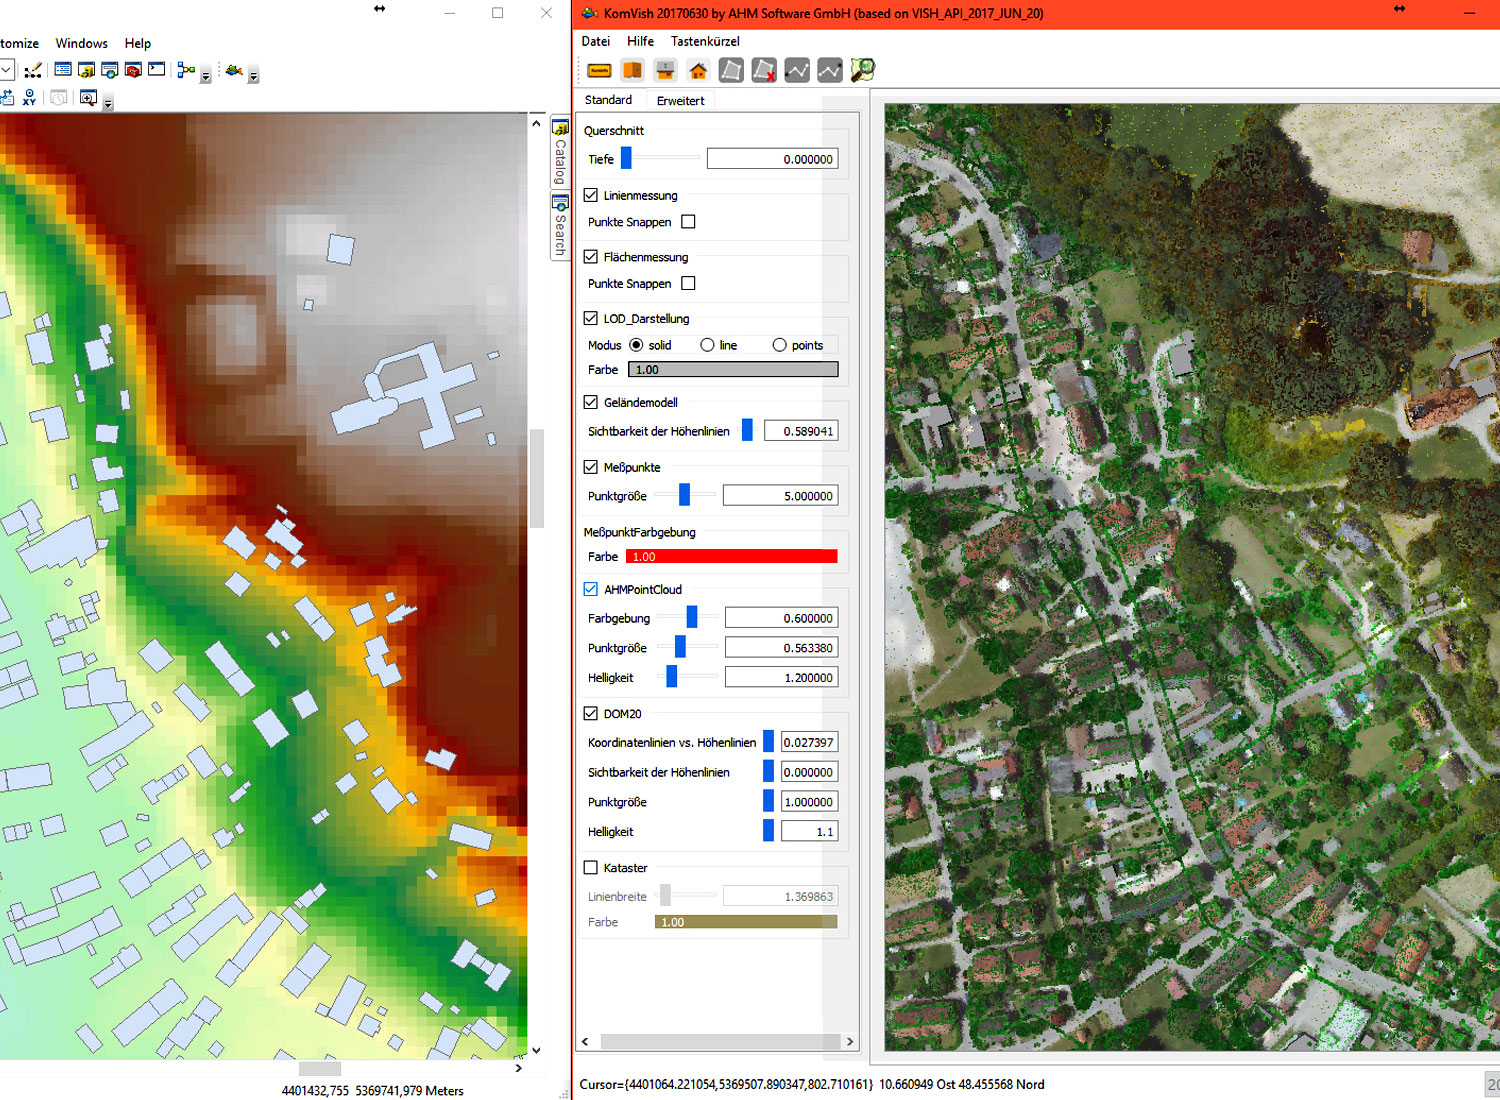
GIS Integration
Your step into handling mass geodata on your own.
Integration with ArcGIS
The KomVish viewer is based on HydroVish technology and allows for easy integration with GIS software.
Download
Your step into handling mass geodata on your own.