Hydro Mapping
A technical revolution to cover our waters.What is Hydro Mapping?
Airborne Hydromapping is a new technology for the very detailed survey of rivers, lakes and reservoirs. This airborne-operated, water-penetrating laser system is considered as a technical revolution for the comprehensive and simultaneous monitoring of shallow water bodies (depths down to 8 m), and the adjacent foreland with an accuracy of less than 10 cm. In contrast, sonar measurements are traditionally utilized to determine the deeper bathymetry of rivers, deltas, lakes, and reservoirs (depths of 2 m down to more than 100 m). Combining echo sounding and airborne laser scanning data results in a detailed view of the water body and the surrounding foreland.
Test Case for Lake Constance as a F5 File
This is a test case of the harbor „Unteruhldingen“ at the Lake Constance in Germany. The test case is saved as a F5 binary file with x, y and z coordinates. The original size of the text file is three times bigger than the F5 File. Additional data like amplitude, reflectance etc. can be easily added. For huge data – this is actually the strength of the F5-Format – a fast and efficient fragmentation of the data is applied and therefore the point cloud can be rendered fragment by fragment in our software HydroVISH. If you’re interested to investigate the layout of the test case simply download the file and browse it with the open source software HDFView.
Bathymetric Features
- distance and angle measurements
- definition of river axis including side axes
- extract cross sections
- pdf export of cross sections
- various data import: LAS format, ASCII point data, ESRI, Shapefiles,TIF/GeoTIF …
- user defined named point selections
- computation modules can be restricted to work on selections
- geometric analysis of point clouds
- automated topographic and bathymetric filter and classification
- water/surface extraction
- level of detail point cloud rendering
- different render modi: color by scalar data field (e. g. classification), color by height, color by images, surface shaded points
- Contour lines for 2D/3D surfaces
- Digital elevation model (DEM), digital terrain model (DTM) and digital surface model (DSM)
- Breaking edge detection
AHM video
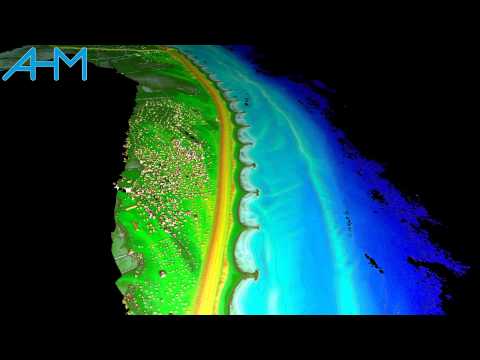
Baltic Sea
[/et_pb_text]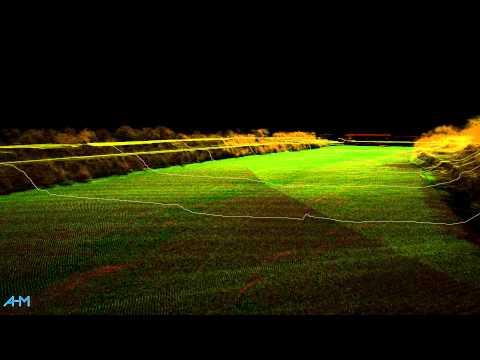
Power Plant Rheinfelden (Germany)
[/et_pb_text]